Last updated on December 6th, 2023
A Histogram can be very confusing to a new photographer or videographer. A lot of times, people ignore them, not understanding them. Fortunately, they are easy to use and can be very helpful. As you’ll find out later, histograms are the most beneficial digital photographers’ tool to have at their fingertips.

Today, you will learn what a histogram is in photography and how to read a histogram to elevate your photography. You’ll then learn a few tricks of the trade to fix any exposure errors and make your images the best they can be. You’ll also get a free tutorial on exploring histograms and how to read one. Let’s get started:
What is a Histogram?
A histogram is a bar chart of how exposed the pixels in your image are. The x-axis represents black to white, with grays between. These are laid out 0 to 255, totaling 256 shades. The y-axis (vertical axis) defines how many of the pixels in your image are that value.
You can see a picture’s histogram on your camera, and it will tell if you need to adjust the exposure and shoot again. Cameras do not display one by default. To view your cameras, refer to your camera’s manual for instructions.
How To Use a Histogram
You are probably wondering how the heck you might read a histogram. Let us help you. Histograms are a way to measure exposure objectively. They’re perfect for those who can’t see very well. Such as in bright light where it’s hard to see an LCD screen. Histograms don’t replace your eyes and experience.
The best way to check exposure is to look at the picture, not a histogram. Your eyes are always the final judge. Worry about the image more than the histogram. You are smarter than a histogram. Use it as a guide, not as a template.
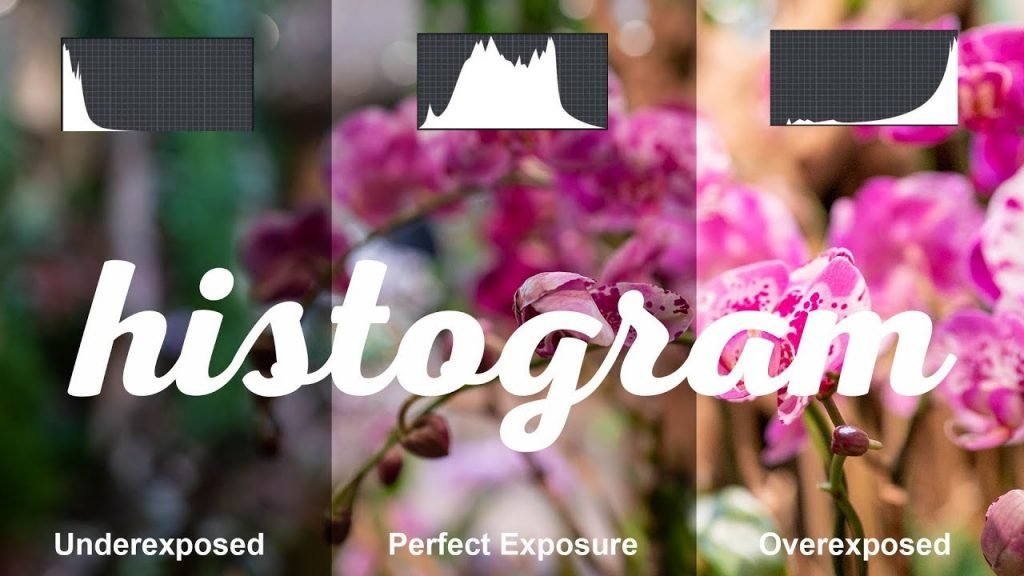
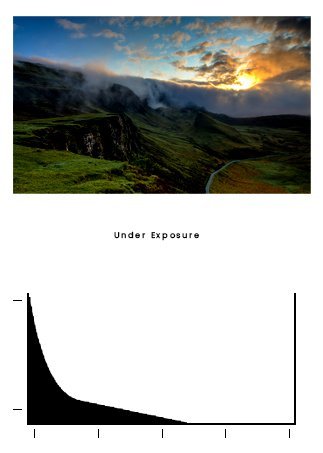
The left of a histogram represents dark parts of the picture, the blacks (shadows). The right means bright details or highlights. Thus, if your histogram has high bars on the left edge, the picture might be too dark.
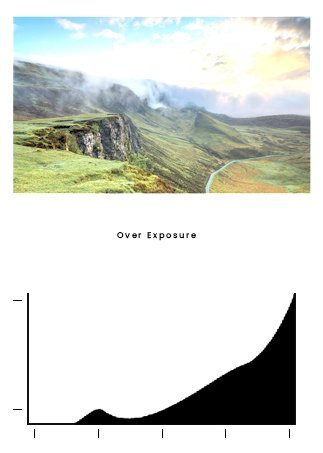
When you look at the middle, you’re looking at midtones. You might want to adjust the exposure to brighten the picture. If the histogram has high bars on the right, the image might be too bright, and you might want to adjust accordingly.
You’ll also notice peaks. These peaks are the pixels numbers of a tone. When you look at all the peaks, you’re looking at many individual tones, starting from zero (pure black) and going to 255 ( pure white).
Benefits of a Histogram
When an image is well-exposed, you’ll see no gaps from the histogram’s left side to the right side of the histogram. You won’t see the right edge heavy and the left edge spilling onto the sides (and vice versa). You’ll see the graph touching each side of the histogram, the right and the left. If there’s an arch in the center, you know you’re doing it right.
How To Correct Exposure
If your histogram shows gaps on both sides, it’s telling you you’re missing information. Thankfully, you can shift the exposure without loss of detail. You’ll then want to adjust your exposure. Let’s say your graph is heavy in one direction and does not touch the other side. Shift the exposure for a wider range of tones.

A histogram is helpful to determine if there is any clipping in the highlights. When you see spikes up the left edge of the histogram’s right edge, it means there are clipping and loss of detail. Overexposure is the death of a digital image. Histograms make this easy to check. If you have clipping 100% white areas, you’ll see a tall vertical line at the far right graph. Reduce exposure if you see clipping. Try to get the histogram close to the right side without touching it.
A little bit of shadow clipping is OK sometimes—for instance, highlights from the sun. Clipping broad areas look awful and often shifts colors. This is an art, and you’ll have to learn what looks acceptable to you. There is no law, so don’t worry about being correct.
However, if you shoot in Raw, you can bring back details in Lightroom’s underexposed areas using your RAW file. Usually, an image is underexposed if no lines go all the way to the right. Images that are too dark are easy to correct. In Adobe Photoshop or Lightroom, drag the exposure slider to meet the edge of the graph. Then, you can convert your final photos into JPEG.

You will have to make decisions with some of your photos with shadow clipping. It’s up to you to determine the scene you’ve shot. It may be worth shooting multiple scenes to figure out what looks best later.
Exposure Compensation and Other Techniques for Camera Histogram
You can also use more advanced photography techniques. Merging, blending, careful post-processing, and HDR are just a few of the things you can do to ensure the exposure is to your liking. You can try HDR tone mapping. With it, you’ll get a lower dynamic range, so the final image is printable.
There’s also a handy tool on most digital DSLR camera settings. It’s referred to as “highlight warnings” or “the blinkies,” which makes an overexposed highlight blink or flash in the preview in your digital camera’s LCD screen for exposure compensation. Your camera will automatically pick out highlights in the preview.
How To Use Highlight Warnings with a Nikon Digital Camera
If you have a Nikon camera, you can preview the image by pressing up or down until you see highlights flashing. The camera might also be outlined in “highlight mode.” By using this setting, your camera remembers it for images moving forward. Note that activation of the feature may be necessary for your camera settings.
Highlight Warnings with a Canon DSLR
On your Canon, depending on your digital camera model, you will choose either display or info. Blinking highlights will appear on the preview image. To turn on the feature, you can choose it in the menu settings. See your digital camera manual for more details.
What is a Histogram in Photography? Frequently Asked Questions
What is an RGB histogram?
An RGB histogram is the same thing as a histogram. It’s a graph on your camera’s LCD of the primary color channels and their brightness level (Red, Green, and Blue). When there are more pixels on the left side, the color will be darker and less prominent. More pixels on the right side means a brighter and denser color.
What is a perfect histogram in photography?
There’s no perfect histogram. All a histogram tells you is the tonal range and the number of pixels, so every image’s histogram will be different in digital photography.
As the photographer, it’s up to you to look in the viewfinder, take the picture, and adjust or post-process the information it reads to you. But you can achieve a great histogram by having solid black and brighter tones.
What does a good histogram look like in digital photography?
A good histogram has most tones in the middle of the graph with little to no tonal value at the right edge or left edge.
What will stop my photos from clipping?
To stop photos from clipping, you can always shoot in RAW mode with the proper metering mode. Use exposure compensation and make use of the histogram to avoid clipping during the shoot. Also, try to shoot during the golden hour when it’s not too bright and not too dark outside, especially when doing outdoor photography like family portraits or landscape photography.
You can also choose to shoot your digital photography on overcast days or in the shade for a similar effect. Next, try techniques like a graduated VND filter, shooting for HDR, or exposure bracketing.
What is ISO photography?
ISO photography is the sensitivity measure of the camera to capture light. What a digital camera does is it converts light from the image sensor to signals for processing. By raising sensitivity, you can get faster shutter speeds. And you will reduce camera blur.
What is image resolution in photography?
The detail of an image is image resolution. More notably, it includes digital photos along with film and other types of photographic images. When you have a rigger resolution, you have greater detail. The image resolution is also measured in line pairs per millimeter.
What is pure black clipping?
Pure black clippings are when the area has no information. It can either be pure highlights as pure white or clipped shadows, known as pure black. When you hear a photographer say that an image is clipped like this, they usually refer to it as “blown out.”
Histogram for Photography Tutorial
Final Thoughts: What is a Histogram in Photography?
When looking at a histogram, don’t get nervous. Its main point is to help you become a better photographer than you already are. And, it is helpful to aid in getting the perfect shot for your digital photography. Always make sure you have rendered tones in the middle of the graph or few tones or none at all at the extreme edges.
When looking at highlight details and shadow details, always make sure to see it from this tutorial. Try out different exposures to see what makes the perfect histogram for you. Also, don’t forget about RGB histograms and monitor the high contrast in your photos for the best-colored photos. But don’t get too much up in arms; you have many options to add to your workflow as a photographer to make your histogram look perfect to you. We hope you build out the ideal photographs using our techniques. And of course, have fun playing around with your work and experimenting!


